Using geospatial tools to build resilience
Source

About This Case Study
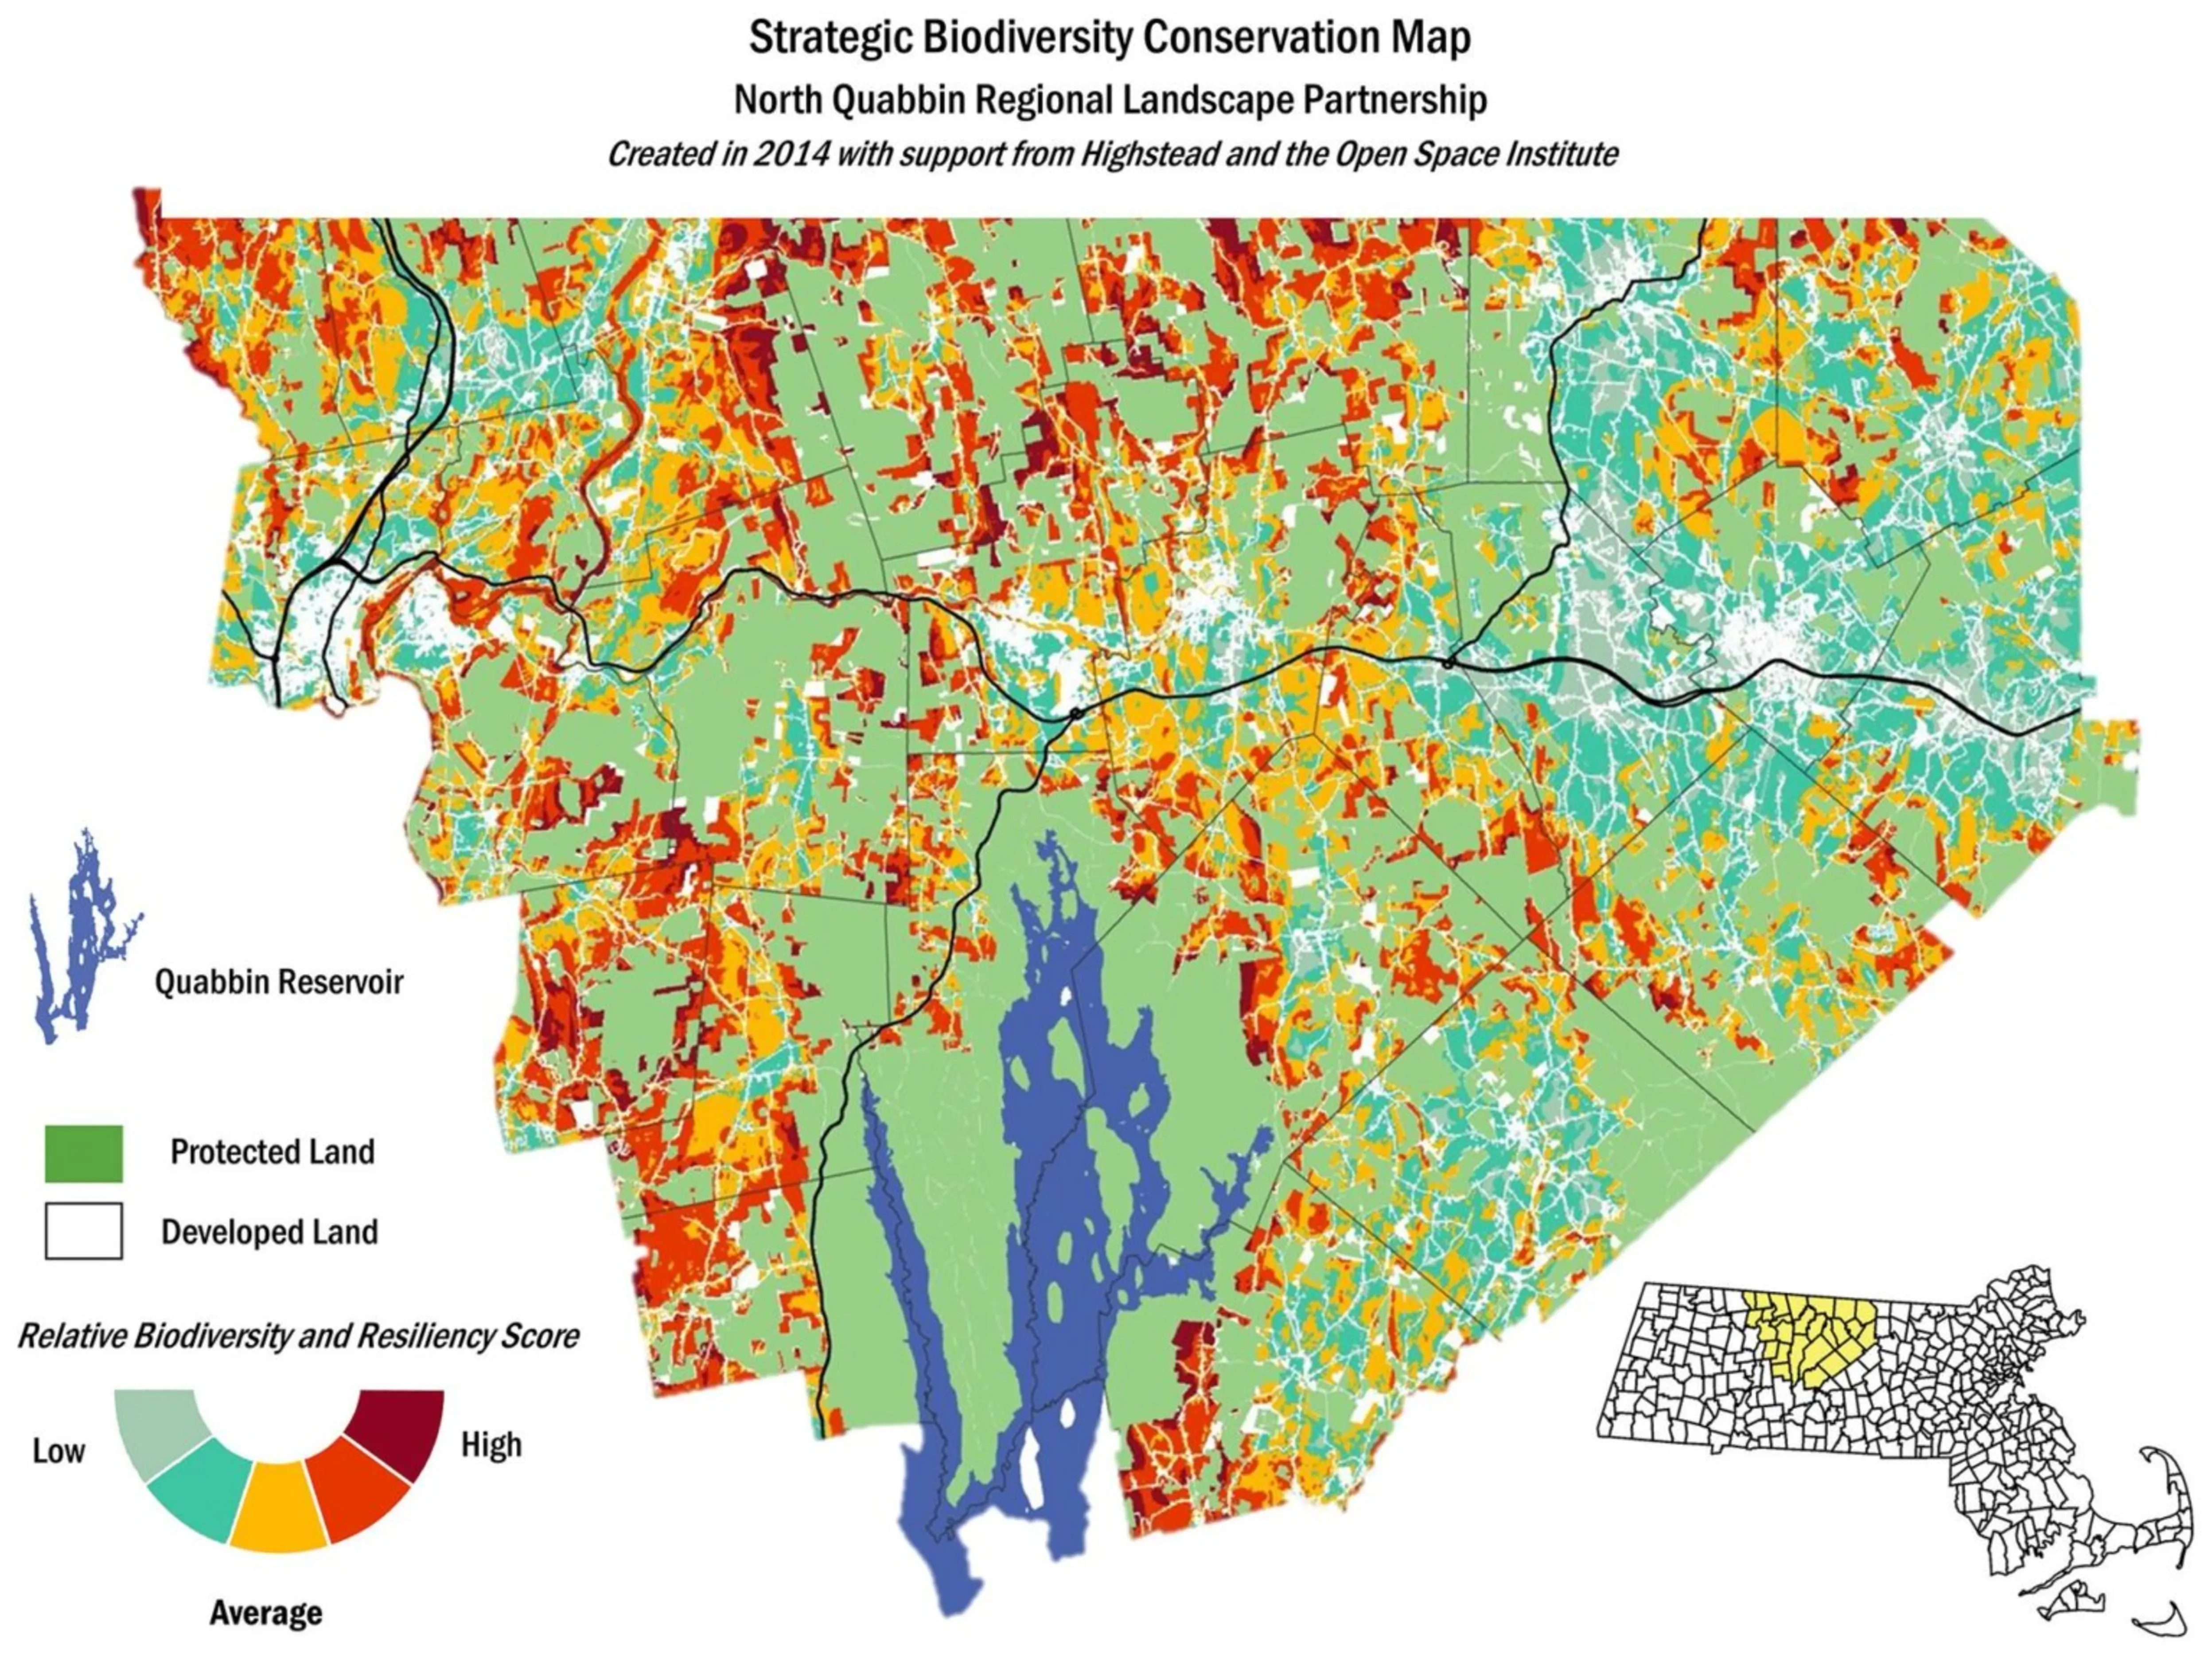
The North Quabbin Regional Landscape Partnership is using geospatial tools to identify conservation priorities to support resiliency in the face of change.
© 2026 Land Trust Alliance, Inc. All rights reserved.
Disclaimer
These resources are provided "as is" for informational purposes only, without warranty of any kind. They do not constitute legal or professional advice and do not create an attorney-client relationship. They may not reflect current legal developments and should be adapted for your organization with qualified professional help. The Alliance is not liable for any damages arising from use of or reliance on these resources. Views in individual posts and third-party links/logos are not Alliance endorsements. The Alliance is committed to equal opportunity and does not condone unlawful discrimination.
For accreditation-related materials, please also consult the Land Trust Accreditation Commission website.
The North Quabbin Regional Landscape Partnership is a regional conservation partnership comprising 23 organizations in the northeastern United States. New England and eastern New York State have nearly 40 RCPs — multistakeholder collaboratives involving land trusts, conservation organizations, public agencies and landowners who work across geographic and political boundaries. Known for its scenic landscapes and historic towns, North Quabbin was one of the first RCPs in this region.
Conservation concerns
Formed in 1997, North Quabbin serves a 560,000-acre area in heavily forested North Central, Massachusetts. Its service area is a tapestry of rolling hills, farmland, wetlands, rivers, lakes and the Quabbin Reservoir, the largest inland body of water in the state and a source of drinking water for two million people. The region includes some of the largest remaining roadless areas in the state and provides habitat for mammals including moose, bobcat and bear, which depend on its large, unfragmented habitat blocks. Places like the Tully Trail and Mount Watatic provide exceptional recreational opportunities within two hours of Boston. All of these resources are experiencing intensive development pressure — and some effects of climate change.
Process of achieving resilience to climate change
Although the partners had discussed climate change and had a breadth of knowledge and intimate understanding of the landscape, few members knew how they could factor climate change into their planning efforts. On a crisp October day in 2013, more than 30 people hunkered down in a conference room with computers and plenty of coffee. This meeting was the first of three half-day workshops at the Millers River Environmental Center in Athol, Massachusetts. In attendance were representatives from six land trusts, five towns, two state agencies (including the Massachusetts Department of Fish and Game), one planning commission, one academic institution, and a conservation group—16 of North Quabbin’s 23 partner organizations. The task: to create a digital map that identified places in their 26-town service area most likely to protect natural resources as the climate changes. This map would be more than a locator of conservation targets. It would also serve as the foundation for a strategic, long-term conservation plan and as a springboard for community engagement on climate concerns. Though no strangers to collaboration, each of the member organizations had its own perspectives and values. The series of workshops set up to advance the planning process created an opportunity to put differences on the table and chart a path forward.
Brian Hall, a geographic information system expert and a research assistant at Harvard Forest, presented the conceptual background on geodiversity landform complexity, and local connectedness and explained that datasets had recently been developed specifically to help steer land protection to ecologically resilient sites. Each member was asked to rank items on a list of nearly 40 datasets and GIS layers. Each participant had 100 points to assign as desired to the listed conservation values. When tallied, the votes showed areas of agreement. Buffering protected land and making more connections to the “accidental wilderness” received many points. Species populations and other traditional conservation values also held sway, in part because they reflected the funding priorities of grants from the Commonwealth of Massachusetts. TNC’s climate resilience data were also favored. Despite concerns about the details, the group was excited to have a way to incorporate climate science into their planning.
Current status and management efforts
One critical decision was how to incorporate the familiar BioMap2 dataset, which informs the state’s Wildlife Action Plan. Component layers of BioMap2 can be isolated to reveal core forest areas, display wetland features, show the presence of rare species and so on—and the North Quabbin partners valued this information. Moreover, many natural features that BioMap2 identifies are also signs of biological condition, one of the criteria used to assess a landscape’s resilience.
The issue of context and regional priorities also came up in relation to geodiversity. Participants were surprised and proud to learn that their region was home to one of the largest protected areas of low-elevation mafic geology in the Northeast. The Open Space Institute had highlighted this geology as a priority for protection because of its low level of regional conservation, but locally, North Quabbin had already protected 80 percent of this setting. Should the land trusts continue to protect this geology type, or diversify? Ultimately, the partners would vote on data scale, context and which datasets to use—this time, from a highly informed position.
Their choices were to:
The group was then tasked with producing a working map reflecting those decisions and other feedback from the second session. They soon realized that even these narrowed-down options could not all be easily represented on a single map. “If we included everything, nobody would understand what it showed,” GIS expert Brian Hall said. “It had to be explainable to someone in less than three minutes.” So he came up with an interactive website to help people understand what the data showed. On their own time, participants could play with the layers they’d selected, turning features on and off to see how their choices affected each of four “straw man” models Hall had created.
Several of the selected datasets reflected similar conservation values, so people had, in effect, chosen to do one thing—emphasize contiguous forest cover—in several different ways. So Hall made an executive decision: Basing the choice of datasets to use on overall trends, he selected the newest and highest-quality set of data for represented blocks for connected forestland. Using all the datasets would overload the co-occurrence model and make it difficult to understand. Also, in the name of simplicity, he awarded equal weight to each conservation value selected.
At the second meeting, in November 2013, Hall showed the participants the results of their conservation feature rankings and unveiled the draft map based on their overall preferences. The map was a window showing where they were headed, but the vision was still too general to drive their conservation plan. So their next task was to refine their choices. How best to combine familiar measures of biological diversity with physical measures focused on landform characteristics? Equally, or favoring one over the other? To help answer these questions, the GIS team presented map models in which various sites “popped out” as ecologically significant depending on how data layers were combined and weighted. The models reflected different feature rankings, depending on whether TNC resilience data were used, and different scales.
The participants incorporated the four terrestrial resilience characteristics into their map and plan, and did it in a way that assessed what was relevant to their historical priorities. By choosing TNC’s Resilience dataset, for example, they accessed combined information about geodiversity, landform diversity and local connectedness. The two underrepresented settings datasets provided them with additional information about geodiversity, and the regional flow dataset offered new details about their area’s connectivity. The partners were able to infer landscape condition in two ways. They were personally familiar with the state of the land, having long worked in the area. Also, the data layers in BioMap2 provided information about the current status of important plant and animal communities. North Quabbin’s final map shows resilience “hot spots” in crimson and minimally resilient lands in pale blue. The colors highlighted three heavily wooded places, two of them new to the partners, which had multiple resilience traits.
Plans for the future
The mapmaking process equipped the North Quabbin partners with the knowledge and skills to be proactive about climate change. They learned how to translate the science, develop a climate-inclusive conservation plan, and bring that knowledge to their work with landowners. Moreover, the organization views its new climate-inclusive plan as a living tool for advancing the conversation on climate change. Wells said, “In the past, our maps were more for internal use. This one’s especially significant because of its potential to bring public engagement around an important topic.” The map also stands as a replicable model, so practitioners can use the resilience concepts and related datasets in their future work. The group is using this map to help communities think – and plan – more broadly about the future of the landscape in the North Quabbin.
Through the mapping process, North Quabbin identified several resilient places where multiple partners have already expressed interested in working and submitted grant applications to the U.S. Forest Legacy Program and the Commonwealth of Massachusetts. Nevins observed, “One of the major advantages of doing a large-scale regional mapping process is that we can look across boundaries, and see where we can improve collaboration and potentially spark new projects.” The partnership has begun outreach to multiple audiences at the regional level. These groups include town boards, landowners, and local residents. North Quabbin is also having an effect beyond the Bay State. The partnership has been making presentations to hundreds of people at gatherings of other RCPs and recently shared its mapmaking story at an OSI-led session at the Land Trust Association’s Rally 2015 in California. There, the audience included many western and a few international land trusts.
Key partners
The workshops were led by the Highstead Foundation, a Connecticut-based nonprofit conservation and research organization that promotes RCPs to accelerate land conservation, supported by a Catalyst Planning Grant from the Open Space Institute’s Resilient Landscapes Initiative; it is one of 20 such projects completed or in progress across the east.
Ongoing partnership and support from the North Quabbin RCP’s members and the communities they serve contributed to the success of this mapping effort and will support its application to land management planning moving forward.
Lessons learned
Both North Quabbin and Highstead viewed the mapmaking process as a success, with some qualifications. A post-workshop survey and interviews identified factors that helped or hindered the exercise.
Trust is key.
The partners enjoyed a high pre-existing level of trust because they were accustomed to working together and were already comfortable thinking regionally
Committed members support active participation.
The members had a keen interest in tackling climate “beyond the handwringing,” as one member put it, and showed great interest in “getting it right”—so much so that some points they raised during the training are being incorporated into revisions of TNC’s Resilience dataset.
Highly skilled tech leads enable complex data analysis.
Several of North Quabbin’s members had GIS experience or scientific backgrounds, but participants agreed that without the expertise and flexibility of Harvard Forest’s Brian Hall to “lay out decision paths in the form of if/then,” as Bill Labich put it, mastering the concepts and tools would have been more difficult.
Perhaps the most resounding lesson of all, though, was that “it let us see that we can do something about climate change,” Wells said. “Now we have a resource to guide us, and it will lead to conservation on the ground over the coming years.”
Land trusts that want to follow in North Quabbin’s footsteps have several options.

North Quabbin Regional Landscape Partnership
Location: 560,000-acre area in Massachusetts
The North Quabbin Regional Landscape Partnership was established in 1997 and has 26 member organizations.